October Wrap-up and What’s to come in November
Each month, we will bring you a recap on major market activity and economic news, as well as important dates to come in the following month.
This month, we’ll also give our thoughts on the “AI Bubble” chatter and a look back at “bubbles” of the past.
Market Performance Overview:
October saw mixed results across global financial markets. The S&P 500 rose 2.34% for the month, extending its year-to-date gain to 17.52% and reaching new record highs.
- Technology stocks continued to outperform in October with a gain of 6.23% for the month.
- The Magnificent Seven (large-cap tech leaders) remained key drivers of market gains, supported by strong profitability and positive earnings revisions.
- Small-cap stocks showed signs of positive activity, with the Russell 2000’s performance up 1.81% for the month and 12.39% YTD.
- Gold experienced a sharp pullback but remains in a longer-term uptrend.
Economic Data: Rates, Inflation, Labor Market
- The U.S. Federal Reserve cut its benchmark interest rate by 0.25% in October to 3.75- 4.00%, following a .25% cut just a month prior.
- The intent of the cut could have been an effort to support the economy by reducing policy tightness and minimizing signs of labor market weakness. Inflation remains above the Fed’s 2% target, driven by higher energy and housing costs.
- Labor market data showed continued softening, with employment growth slowing and unemployment edging higher, though consumer and business balance sheets remain healthy.
- Consumer spending remains resilient, helping to offset some economic headwinds.
Corporate Earnings and Sector Highlights:
Corporate earnings for the third quarter point to solid momentum across several key sectors.
- Approximately 64% of S&P 500 companies that reported Q3 results in October exceeded earnings per share (EPS) expectations, with about 83% beating revenue estimates.
- October earnings helped drive the S&P 500 to a new record high, surpassing 6,900 points, aided by a 25-basis-point Fed rate cut and strong results from technology and financial sectors.
Geopolitical and Notable Global Developments:
- Geopolitical risks and trade tensions persisted, but markets rebounded quickly from related disruptions.
- Investors largely dismissed concerns about a potential U.S. government shutdown, focusing instead on central bank policy and economic data.
- Asian markets remained resilient, while European central banks maintained current policies amid slowing growth and elevated inflation.
Here’s What to Look for in November:
Looking ahead, several key events and data releases may influence market direction:
Key dates for October:
- Q3 earnings season continues with major companies reporting results through mid-November.
- November 13: U.S. Consumer Price Index (CPI) for October will be released, providing an update on inflation trends. Ongoing developments in global trade, energy prices, and policy initiatives will remain in focus.
- November 27: Thanksgiving Day markets closed.
- November 28: Markets close early.
Our thoughts on the “AI Bubble”:
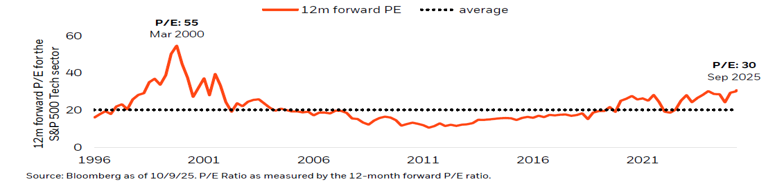
Speculations over the “AI Bubble” and its potential have been mixed. We believe there are several factors that can influence the realization of the Bubble when compared to those of the past (Tech or Dot Com).
The tech sector today is supported by stronger fundamentals and more sustainable growth:
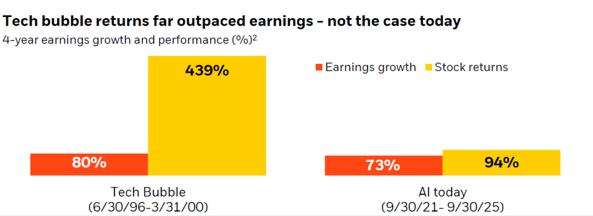
- Valuations are more grounded: Unlike the speculative excesses during the tech bubble, companies at the heart of today’s AI boom are showing substantial earnings (73% growth) and cash flow, anchoring their market performance to real financial results (94% stock returns). In contrast, tech bubble stock returns soared 439% over four years, far outpacing the 80% earnings growth in the same period.
- Internally funded capex: Most AI-related capital investment is now financed through cash balances and ongoing earnings, rather than relying heavily on debt. This lowers financial risk and makes growth more sustainable.
- Tangible demand: AI investment is driven by robust real-world demand, with global data center growth expected at 19–22% annually through 2030, not just future promises or hype.
Overall, headline indices reached new highs in October. Investors continue to monitor central bank actions, inflation data, and geopolitical developments as the year draws to a close.
As always, please reach out to us with any questions or to discuss your specific situation.
Sources:
https://www.morningstar.com/markets
https://www.federalreserve.gov/newsevents/pressreleases/monetary20250917a.htm
Disclosures:
Content in this material is for general information only and not intended to provide specific advice or recommendations for any individual.
All performance referenced is historical and is no guarantee of future results.
All investing involves risk including loss of principal.
No strategy assures success or protects against loss.
There is no guarantee that a diversified portfolio will enhance overall returns or outperform a non-diversified portfolio.
Diversification does not protect against market risk.
The economic forecasts set forth in this material may not develop as predicted and there can be no guarantee that strategies promoted will be successful.
Investment advice offered through Shepherd Financial Partners, LLC, a registered investment advisor. Registration as an investment advisor does not imply any level of skill or training.
Securities offered through LPL Financial, member FINRA/SIPC. Shepherd Financial Partners and LPL Financial are separate entities.
Additional information, including management fees and expenses, is provided on Shepherd Financial Partners, LLC’s Form ADV Part 2, which is available by request.
The Standard & Poor’s 500 Index is a capitalization weighted index of 500 stocks designed to measure performance of the broad domestic economy through changes in the aggregate market value of 500 stocks representing all major industries.
The prices of small cap stocks are generally more volatile than large cap stocks.
The Russell 2000 Index is an unmanaged index generally representative of the 2,000 smallest companies in the Russell 3000 index, which represents approximately 10% of the total market capitalization of the Russell 3000 Index.
Bonds are subject to market and interest rate risk if sold prior to maturity. Bond values will decline as interest rates rise and bonds are subject to availability and change in price.
The Bloomberg U.S. Aggregate Bond Index is an index of the U.S. investment-grade fixed-rate bond market, including both government and corporate bonds.
The fast price swings of commodities will result in significant volatility in an investor’s holdings.
Tracking #: 820844